
How Can We Help?
Media in category "Data and diagrams"
The following 23 files are in this category, out of 23 total.
-
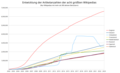
 Artikelwachstum in der deutschsprachigen Wikipedia.png 1,734 × 1,099; 514 KB
-
 Artikelzahl in dewiki 01 (fcm).png 1,589 × 966; 55 KB
-

-
 Growth of proportion of illustrated articles in the past year.png 600 × 371; 24 KB
-
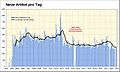 Neue Artikel pro Tag in dewiki (fcm).jpg 1,481 × 893; 363 KB
-
 Neue Artikel pro Tag in dewiki 02 (fcm).png 1,587 × 965; 95 KB
-
 Number of articles with and without images, across all languages.png 600 × 371; 18 KB
-
 Percent of Active German Wikipedia Editors Who Make 100+ Edits.svg 804 × 604; 47 KB
-
 Percentage illustrated articles.png 898 × 371; 15 KB
-
 Percentage of commons files by type August 2012.png 660 × 460; 22 KB
-
 Perlang img counts.png 902 × 570; 98 KB
-
 Statistics Active Wikipedians German WP September 2016.png 1,217 × 718; 86 KB
-
 Statistics New Wikipedians German WP September 2016.png 1,211 × 783; 157 KB
-
 Very active editors 5 wikis.svg 1,000 × 600; 32 KB
-
 Wikimedia Commons trends and metrics 1.png 1,274 × 711; 147 KB
-
 Wikimedia Commons trends and metrics 2.png 798 × 612; 29 KB
-
 Wikimedia Commons trends and metrics 3.png 561 × 434; 128 KB
-
 Wikimedia Commons trends and metrics 4.png 1,804 × 1,140; 197 KB
-
 Wikimedia Commons trends and metrics 5.png 1,334 × 1,060; 91 KB
-
 Wikimedia Commons trends and metrics 6.png 856 × 454; 48 KB
-
 Wikipedia-Artikelanzahl-Entwicklung-Top8.png 1,637 × 993; 115 KB
-
 Wikipedianer ab 10 edits September 2016.png 1,265 × 782; 59 KB
-
 Zahl der täglich neu erstellten Artikel in dewiki.png 1,734 × 1,099; 530 KB


Recent Comments