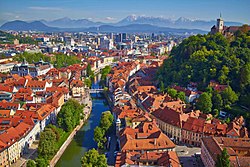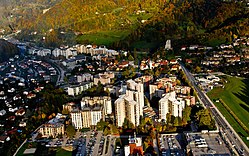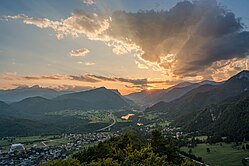


There are 69 towns in Slovenia.[1] According to the Local Self-Government Act of the Republic of Slovenia, a town is a larger urban settlement with more than 3,000 residents and differing from other settlements in its size, economical structure, population, population density and historical development.[2] A settlement acquires the status of town through a decision by the Government of Slovenia.[2] Until 2005, the decision was made by the National Assembly of Slovenia.[2]
List of all towns in Slovenia
Figures are based on the statistics from the Statistical Office of the Republic of Slovenia.[3]
| Rank | Name | Population | Traditional region | ||
|---|---|---|---|---|---|
| 2024 pop. | 2011 pop. | Percentage change | |||
1.
|
288,382
|
272,220
|
Upper and Lower Carniola | ||
2.
|
97,068
|
95,171
|
Styria | ||
3.
|
37,802
|
36,874
|
Upper Carniola | ||
4.
|
37,727
|
37,520
|
Styria | ||
5.
|
26,305
|
24,996
|
Slovene Littoral | ||
6.
|
25,473
|
25,456
|
Styria | ||
7.
|
24,446
|
23,341
|
Lower Carniola | ||
8.
|
18,274
|
18,164
|
Styria | ||
9.
|
13,807
|
13,644
|
Upper Carniola | ||
10.
|
13,778
|
13,440
|
Upper Carniola | ||
11.
|
13,742
|
15,163
|
Styria | ||
12.
|
13,316
|
12,406
|
Upper Carniola | ||
13.
|
13,043
|
13,178
|
Slovene Littoral | ||
14.
|
11,887
|
11,969
|
Upper Carniola | ||
15.
|
11,489
|
11,223
|
Slovene Littoral | ||
16.
|
11,075
|
11,614
|
Prekmurje | ||
17.
|
10,144
|
8,942
|
Inner Carniola | ||
18.
|
10,079
|
9,183
|
Inner Carniola | ||
19.
|
9,125
|
8,413
|
Inner Carniola | ||
20.
|
8,292
|
7,454
|
Styria | ||
21.
|
8,147
|
8,672
|
Lower Carniola | ||
22.
|
7,804
|
7,098
|
Lower Carniola | ||
23.
|
7,651
|
7,519
|
Styria | ||
24.
|
7,253
|
6,112
|
Upper Carniola | ||
25.
|
7,183
|
6,979
|
Carinthia | ||
26.
|
7,072
|
6,656
|
Slovene Littoral | ||
27.
|
6,961
|
6,573
|
Styria | ||
28.
|
6,884
|
7,097
|
Lower Carniola | ||
29.
|
6,710
|
6,467
|
Upper Carniola | ||
30.
|
6,146
|
5,531
|
Slovene Littoral | ||
31.
|
6,099
|
5,940
|
Upper Carniola | ||
32.
|
6,037
|
6,439
|
Upper Carniola | ||
33.
|
5,793
|
5,955
|
Slovene Littoral | ||
34.
|
5,473
|
5,776
|
Lower Carniola | ||
35.
|
5,343
|
5,178
|
Upper Carniola | ||
36.
|
5,233
|
4,869
|
Styria | ||
37.
|
5,202
|
5,181
|
Upper Carniola | ||
38.
|
5,177
|
5,111
|
Styria | ||
39.
|
5,082
|
4,943
|
Styria | ||
40.
|
5,007
|
4,762
|
Styria | ||
41.
|
4,794
|
5,621
|
Styria | ||
42.
|
4,591
|
4,660
|
Styria | ||
43.
|
4,590
|
4,643
|
Carinthia | ||
44.
|
4,352
|
4,553
|
Inner Carniola | ||
45.
|
4,233
|
4,503
|
Styria | ||
46.
|
4,132
|
3,928
|
Inner Carniola | ||
47.
|
3,938
|
3,477
|
Lower Carniola | ||
48.
|
3,821
|
3,865
|
Upper Carniola | ||
49.
|
3,736
|
3,588
|
Upper Carniola | ||
50.
|
3,725
|
3,604
|
Lower Carniola | ||
51.
|
3,671
|
4,192
|
Slovene Littoral | ||
52.
|
3,634
|
3,760
|
Slovene Littoral | ||
53.
|
3,436
|
3,006
|
Styria | ||
54.
|
3,328
|
3,456
|
Styria | ||
55.
|
3,256
|
3,460
|
Styria | ||
56.
|
3,212
|
3,273
|
Lower Carniola | ||
57.
|
3,196
|
3,534
|
Slovene Littoral | ||
58.
|
3,144
|
3,159
|
Styria | ||
59.
|
3,120
|
3,254
|
Carinthia | ||
60.
|
3,063
|
2,935
|
Styria | ||
61.
|
3,052
|
2,880
|
Styria | ||
62.
|
3,051
|
3,289
|
Carinthia | ||
63.
|
2,906
|
3,075
|
Upper Carniola | ||
64.
|
2,818
|
3,129
|
Prekmurje | ||
65.
|
1,937
|
2,168
|
Lower Carniola | ||
66.
|
1,923
|
2,174
|
Styria | ||
67.
|
1,554
|
1,631
|
Slovene Littoral | ||
68.
|
1,192
|
1,000
|
Lower Carniola | ||
69.
|
698
|
695
|
Lower Carniola | ||
References
- ^ T. H.; Barbara Štor (19 January 2021). "Slovenija dobila dve novi mesti, Zreče in Lenart" (in Slovenian). RTV Slovenija. Retrieved 22 January 2021.
- ^ a b c Žagar, Katarina (October 2007). Lokalna samouprava: organizacija in funkcija [Local Self-Government: Organisation and Function] (PDF) (in Slovenian) (5th ed.). Administration Academy, Ministry of Public Administration. p. 28. Archived from the original (PDF) on 2011-07-26.
- ^ "Population - municipalities and settlements, Slovenia, yearly (in Slovenian)". SURS. Retrieved 15.6.2024.
{{cite web}}: Check date values in:|access-date=(help)
External links
 Media related to Cities in Slovenia at Wikimedia Commons


Recent Comments