
Original file (1,199 × 761 pixels, file size: 19 KB, MIME type: image/png)
Summary
| Description |
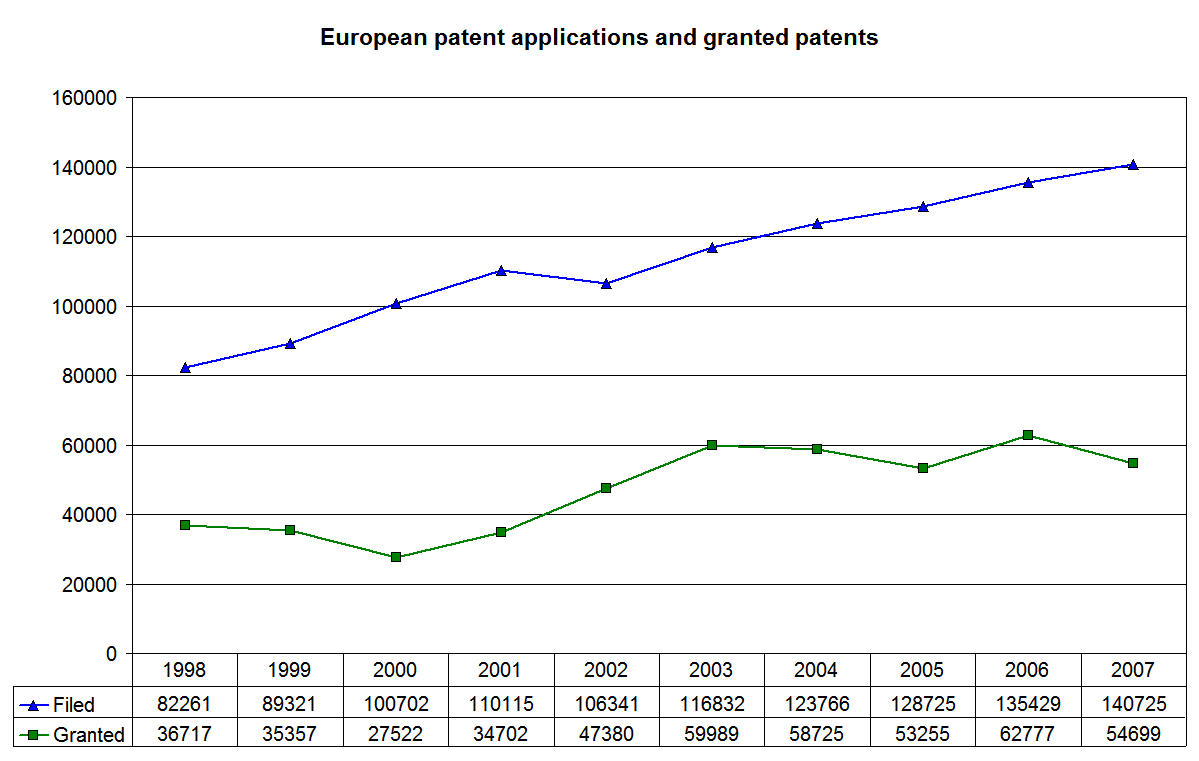
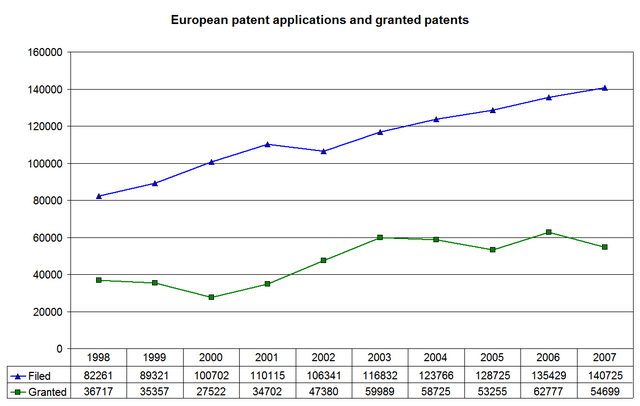
Graph showing European patent applications filed and patents granted from 1997 to 2008. Original data values copied below. Note that, in 2007, the average time from filing to grant was 43.7 months (just over 3.6 years)[1] |
|---|---|
| Source |
Self-made graph based on data published by the European Patent Office on their website (terms of use). |
| Date |
19 February 2009 |
| Author |
Geoff Dallimore |
| Permission (Reusing this file) |
Information and materials taken from the EPO website are governed by their terms of use. All other rights in this representation of that information are hereby released into the public domain by the creator. |
| Other versions | None |
Licensing
Original data
The original data values are as follows.
| Year | Filed[2] | Granted[3] |
|---|---|---|
| 1998 | 82261 | 36717 |
| 1999 | 89321 | 35357 |
| 2000 | 100702 | 27522 |
| 2001 | 110115 | 34702 |
| 2002 | 106341 | 47380 |
| 2003 | 116832 | 59989 |
| 2004 | 123766 | 58725 |
| 2005 | 128725 | 53255 |
| 2006 | 135429 | 62777 |
| 2007 | 140725 | 54699 |
File history
Click on a date/time to view the file as it appeared at that time.
| Date/Time | Thumbnail | Dimensions | User | Comment | |
|---|---|---|---|---|---|
| current | 10:58, 19 February 2009 | | 1,199 × 761 (19 KB) | GDallimore (talk | contribs) | {{Information |Description=Graph showing European patent applications filed and patent granted from 1997 to 2008. Note that, in 2007, the average time from filing to grant was 43.7 months (just over 3.6 years)[http://www.epo.org/about-us/office/annual-rep |
You cannot overwrite this file.

Recent Comments