
Carcar, officially the City of Carcar (Cebuano: Dakbayan sa Carcar; Hiligaynon: Dakbanwa sang Carcar; Filipino: Lungsod ng Carcar), is a 5th class component city in the province of Cebu, Philippines. According to the 2020 census, it has a population of 136,453 people.[3]
Carcar City is bordered to the north by the town of San Fernando, to the west are the towns of Barili and Aloguinsan, to the east is the Cebu Strait, and to the south is the town of Sibonga.
Carcar lies on the southernmost part of Metro Cebu area.[5]
History
Carcar was known as "Kabkad" or "Sialo" before Spanish colonization.[6] It became a town in 1599. Carcar is considered one of the oldest towns in Cebu, with its Spanish influence lasted more than 300 years ago.
Cityhood
In July 2007, the municipality of Carcar was converted into a component city of the province of Cebu after ratification of Republic Act 9436.
On November 18, 2008, Supreme Court ruled that the cityhood charters of Carcar and 15 other cities as unconstitutional as a result of a petition filed by the League of Cities of the Philippines. A year later, on December 22, Carcar and 15 other municipalities regained their status as cities again after the court reversed its November 18, 2008, ruling. On August 23, 2010, the court reinstated its ruling on November 18, 2008, causing Carcar and 15 cities to revert to municipalities. Finally on February 15, 2011, Carcar and the other 15 municipalities regained their cityhood status.
In 2013, after a six year legal battle, the League of Cities of the Philippines acknowledged and recognized the cityhood of Carcar and 15 other cities on July 19, 2013.[7][8]
Geography
Carcar is located 40 kilometres (25 mi) south of Cebu City. It has a land area of 116.78 square kilometres (45.09 sq mi).
- Topography
The land is generally level with less than 18% slope comprising 78.7% of the total land area. Areas with slopes ranging from 18 to 50% cover 19.3% of the total land area and those over 50% slope comprise approximately 1.9%. The highest recorded elevation is a little over 660 metres (2,170 ft) above sea level, located within the barangay of Napo.
- Soil type
The municipality has five dominant soil types namely: Faraon Clay, Steep Phase, the Lugo Clay, the Mandaue clay loam & the Hydrosol type.
Barangays
Carcar is politically subdivided into 15 barangays. Each barangay consists of puroks and some have sitios.
| PSGC | Barangay | Population | ±% p.a. | |||
|---|---|---|---|---|---|---|
| 2020[3] | 2010[9] | |||||
| 072214001 | Bolinawan | 8.0% | 10,881 | 10,852 | 0.03% | |
| 072214002 | Buenavista | 2.0% | 2,662 | 2,294 | 1.50% | |
| 072214003 | Calidngan | 2.4% | 3,258 | 2,953 | 0.99% | |
| 072214004 | Can‑asujan | 6.7% | 9,114 | 7,845 | 1.51% | |
| 072214005 | Guadalupe | 9.3% | 12,641 | 10,633 | 1.74% | |
| 072214006 | Liburon | 5.6% | 7,606 | 6,749 | 1.20% | |
| 072214007 | Napo | 4.7% | 6,427 | 6,344 | 0.13% | |
| 072214008 | Ocaña | 6.9% | 9,361 | 8,507 | 0.96% | |
| 072214009 | Perrelos | 10.4% | 14,129 | 12,901 | 0.91% | |
| 072214012 | Poblacion I | 8.0% | 10,919 | 8,996 | 1.96% | |
| 072214013 | Poblacion II | 2.0% | 2,680 | 2,432 | 0.98% | |
| 072214014 | Poblacion III | 5.1% | 6,898 | 5,763 | 1.81% | |
| 072214015 | Tuyom | 4.5% | 6,080 | 5,563 | 0.89% | |
| 072214010 | Valencia | 4.0% | 5,485 | 4,885 | 1.17% | |
| 072214011 | Valladolid | 8.4% | 11,523 | 10,606 | 0.83% | |
| Total | 136,453 | 107,323 | 2.43% | |||
Climate
The wet season occurs during the months of May to October and the dry season, from January to May.
| Climate data for Carcar, Cebu | |||||||||||||
|---|---|---|---|---|---|---|---|---|---|---|---|---|---|
| Month | Jan | Feb | Mar | Apr | May | Jun | Jul | Aug | Sep | Oct | Nov | Dec | Year |
| Mean daily maximum °C (°F) | 28 (82) |
29 (84) |
30 (86) |
31 (88) |
31 (88) |
30 (86) |
30 (86) |
30 (86) |
30 (86) |
29 (84) |
29 (84) |
28 (82) |
30 (85) |
| Mean daily minimum °C (°F) | 23 (73) |
23 (73) |
23 (73) |
24 (75) |
25 (77) |
25 (77) |
25 (77) |
25 (77) |
25 (77) |
25 (77) |
24 (75) |
23 (73) |
24 (75) |
| Average precipitation mm (inches) | 70 (2.8) |
49 (1.9) |
62 (2.4) |
78 (3.1) |
138 (5.4) |
201 (7.9) |
192 (7.6) |
185 (7.3) |
192 (7.6) |
205 (8.1) |
156 (6.1) |
111 (4.4) |
1,639 (64.6) |
| Average rainy days | 13.4 | 10.6 | 13.1 | 14.5 | 24.2 | 27.9 | 28.4 | 27.7 | 27.1 | 27.4 | 22.5 | 15.9 | 252.7 |
| Source: Meteoblue (Use with caution: this is modeled/calculated data, not measured locally.)[10] | |||||||||||||
Demographics
| Year | Pop. | ±% p.a. |
|---|---|---|
| 1903 | 31,895 | — |
| 1918 | 37,392 | +1.07% |
| 1939 | 36,308 | −0.14% |
| 1948 | 32,818 | −1.12% |
| 1960 | 36,304 | +0.84% |
| 1970 | 45,806 | +2.35% |
| 1975 | 47,174 | +0.59% |
| 1980 | 57,822 | +4.15% |
| 1990 | 70,841 | +2.05% |
| 1995 | 78,726 | +2.00% |
| 2000 | 89,199 | +2.71% |
| 2007 | 100,632 | +1.68% |
| 2010 | 107,323 | +2.37% |
| 2015 | 119,664 | +2.09% |
| 2020 | 136,453 | +2.62% |
| Source: Philippine Statistics Authority[11][9][12][13] | ||
Economy
Poverty Incidence of Carcar
10
20
30
40
2006
35.00 2009
27.21 2012
17.02 2015
21.39 2018
13.80 2021
30.71 Source: Philippine Statistics Authority[14][15][16][17][18][19][20][21] |
Tourism

- As a Heritage City of Cebu, Carcar contains various Spanish and American period structures. The Carcar plaza alone hosts several heritage structures, the Church of St. Catherine of Alexandria dominates the area. Within the complex various structures stand, including quaint houses and their distinctive architectural details.
- Surrounding the Rotunda and in the public market one will find the famous Carcar chicharon, lechon, ampao, bucarillo, gorgorias and puso – just some of the local delicacies.
- Guadalupe Mabugnao Mainit Hot Spring National Park
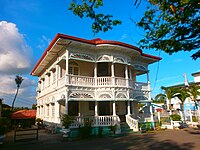
- Heritage Houses such as the Mercado Mansion
- Tuyom Beach – Beach Houses
- The Kabkaban Festival, which is the town's local festival in honor of St. Catherine of Alexandria. The name of the festival comes from the old name of the town, which was taken from the local term for the Oakleaf Fern (Aglaomorpha quercifolia) which is abundant in the town, even to this day. Celebrated from the November 23 to 25, it highlights the rich culture, faith, and musical history of Carcar.
Notable personalities
- Teofilo Camomot – founded the Congregation of Blessed Virgin Missionaries
- Sheryn Regis – singer
Gallery
-
 Rizal Monument at Old Town Plaza
 -
 Carcar City Museum (formerly, Carcar Dispensary)
 -
 St. Catherine of Alexandria Church Interior
 -
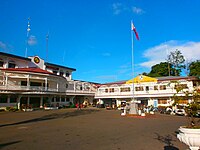 Carcar Former Municipal Complex


References
- ^ City of Carcar | (DILG)
- ^ "2015 Census of Population, Report No. 3 – Population, Land Area, and Population Density" (PDF). Philippine Statistics Authority. Quezon City, Philippines. August 2016. ISSN 0117-1453. Archived (PDF) from the original on May 25, 2021. Retrieved July 16, 2021.
- ^ a b c Census of Population (2020). "Region VII (Central Visayas)". Total Population by Province, City, Municipality and Barangay. Philippine Statistics Authority. Retrieved July 8, 2021.
- ^ "PSA Releases the 2021 City and Municipal Level Poverty Estimates". Philippine Statistics Authority. April 2, 2024. Retrieved April 28, 2024.
- ^ Sun–Star 2005.
- ^ Inocian, Reynaldo; Irmano, Kristel Joy; Sitoy, Evelyn; Delgado, April Rose; Lozano, Elena (October 29, 2020). "Cebu's Places Named After Endemic Flora: Basis for Innovative Teaching Models". International Journal of Social Sciences and Humanities Invention. 7 (10): 6241–6255. doi:10.18535/ijsshi/v7i010.06. ISSN 2349-2031.
- ^ "16 new cities recognized as LCP members (Archived)". Sun Star News. July 19, 2013. Retrieved March 6, 2018.
- ^ "League finally recognizes 16 'unqualified' cities". Rappler. July 19, 2013. Retrieved March 6, 2018.
- ^ a b Census of Population and Housing (2010). "Region VII (Central Visayas)" (PDF). Total Population by Province, City, Municipality and Barangay. National Statistics Office. Retrieved June 29, 2016.
- ^ "Carcar: Average Temperatures and Rainfall". Meteoblue. Retrieved May 10, 2020.
- ^ Census of Population (2015). "Region VII (Central Visayas)". Total Population by Province, City, Municipality and Barangay. Philippine Statistics Authority. Retrieved June 20, 2016.
- ^ Censuses of Population (1903–2007). "Region VII (Central Visayas)". Table 1. Population Enumerated in Various Censuses by Province/Highly Urbanized City: 1903 to 2007. National Statistics Office.
{{cite encyclopedia}}: CS1 maint: numeric names: authors list (link) - ^ "Province of Cebu". Municipality Population Data. Local Water Utilities Administration Research Division. Retrieved December 17, 2016.
- ^ "Poverty incidence (PI):". Philippine Statistics Authority. Retrieved December 28, 2020.
- ^ "Estimation of Local Poverty in the Philippines" (PDF). Philippine Statistics Authority. November 29, 2005.
- ^ "2003 City and Municipal Level Poverty Estimates" (PDF). Philippine Statistics Authority. March 23, 2009.
- ^ "City and Municipal Level Poverty Estimates; 2006 and 2009" (PDF). Philippine Statistics Authority. August 3, 2012.
- ^ "2012 Municipal and City Level Poverty Estimates" (PDF). Philippine Statistics Authority. May 31, 2016.
- ^ "Municipal and City Level Small Area Poverty Estimates; 2009, 2012 and 2015". Philippine Statistics Authority. July 10, 2019.
- ^ "PSA Releases the 2018 Municipal and City Level Poverty Estimates". Philippine Statistics Authority. December 15, 2021. Retrieved January 22, 2022.
- ^ "PSA Releases the 2021 City and Municipal Level Poverty Estimates". Philippine Statistics Authority. April 2, 2024. Retrieved April 28, 2024.
Sources
- Sun–Star (October 8, 2005). "RDC enlarges Metro Cebu". Archived from the original on September 30, 2007. Retrieved November 10, 2015.
External links
 Media related to Carcar at Wikimedia Commons
 Carcar travel guide from Wikivoyage
- Philippine Standard Geographic Code
Places adjacent to Carcar | |
|---|---|

| International | |
|---|---|
| National | |

Recent Comments