
Caesars Head is an unincorporated community and census-designated place (CDP) on top of Caesars Head, a mountain in Greenville County, South Carolina, United States. It was first listed as a CDP in the 2020 census with a population of 84.[4]
The CDP is in northwestern Greenville County along U.S. Route 276, 2 miles (3 km) south of the North Carolina border. The 3,208-foot (978 m) summit of Caesars Head is in the western part of the CDP, and most of the residential development is in the northeastern part, at elevations ranging from 2,800 to 3,200 feet (850 to 980 m) above sea level. The remainder of the CDP is within Caesars Head State Park.
US 276 (Geer Highway) leads north 15 miles (24 km) to Brevard, North Carolina, and southeast 31 miles (50 km) to Greenville.
Demographics
| Census | Pop. | Note | %± |
|---|---|---|---|
| 2020 | 84 | — | |
| U.S. Decennial Census[5] 2020[6][3] | |||
2020 census
| Race / Ethnicity | Pop 2020[6] | % 2020 |
|---|---|---|
| White alone (NH) | 77 | 91.67% |
| Black or African American alone (NH) | 0 | 0.00% |
| Native American or Alaska Native alone (NH) | 0 | 0.00% |
| Asian alone (NH) | 2 | 2.38% |
| Pacific Islander alone (NH) | 0 | 0.00% |
| Some Other Race alone (NH) | 1 | 1.19% |
| Mixed Race/Multi-Racial (NH) | 1 | 1.19% |
| Hispanic or Latino (any race) | 3 | 3.57% |
| Total | 84 | 100.00% |
Note: the US Census treats Hispanic/Latino as an ethnic category. This table excludes Latinos from the racial categories and assigns them to a separate category. Hispanics/Latinos can be of any race.
Climate
According to the Köppen Climate Classification system, Caesar's Head has a humid subtropical climate, abbreviated "Cfa" on climate maps. The hottest temperature recorded in Caesar's Head was 99 °F (37.2 °C) on July 29, 1952 and August 21, 1983, while the coldest temperature recorded was −19 °F (−28.3 °C) on January 21, 1985, which is the coldest temperature ever recorded in South Carolina.[7][8]
| Climate data for Caesar's Head, South Carolina, 1991–2020 normals, extremes 1925–present | |||||||||||||
|---|---|---|---|---|---|---|---|---|---|---|---|---|---|
| Month | Jan | Feb | Mar | Apr | May | Jun | Jul | Aug | Sep | Oct | Nov | Dec | Year |
| Record high °F (°C) | 73 (23) |
73 (23) |
85 (29) |
90 (32) |
98 (37) |
97 (36) |
99 (37) |
99 (37) |
98 (37) |
89 (32) |
79 (26) |
75 (24) |
99 (37) |
| Mean maximum °F (°C) | 62.0 (16.7) |
64.2 (17.9) |
74.3 (23.5) |
79.1 (26.2) |
81.2 (27.3) |
84.3 (29.1) |
84.8 (29.3) |
83.5 (28.6) |
80.3 (26.8) |
75.2 (24.0) |
69.3 (20.7) |
62.0 (16.7) |
87.0 (30.6) |
| Mean daily maximum °F (°C) | 44.8 (7.1) |
48.3 (9.1) |
55.9 (13.3) |
65.0 (18.3) |
70.0 (21.1) |
75.0 (23.9) |
77.6 (25.3) |
76.2 (24.6) |
71.1 (21.7) |
62.9 (17.2) |
54.9 (12.7) |
47.6 (8.7) |
62.4 (16.9) |
| Daily mean °F (°C) | 36.3 (2.4) |
39.3 (4.1) |
46.3 (7.9) |
54.7 (12.6) |
61.6 (16.4) |
67.7 (19.8) |
70.7 (21.5) |
69.4 (20.8) |
64.3 (17.9) |
55.3 (12.9) |
46.6 (8.1) |
39.9 (4.4) |
54.3 (12.4) |
| Mean daily minimum °F (°C) | 27.9 (−2.3) |
30.3 (−0.9) |
36.6 (2.6) |
44.4 (6.9) |
53.2 (11.8) |
60.4 (15.8) |
63.9 (17.7) |
62.6 (17.0) |
57.6 (14.2) |
47.8 (8.8) |
38.2 (3.4) |
32.1 (0.1) |
46.3 (7.9) |
| Mean minimum °F (°C) | 8.3 (−13.2) |
12.5 (−10.8) |
18.1 (−7.7) |
28.3 (−2.1) |
39.5 (4.2) |
50.9 (10.5) |
57.5 (14.2) |
55.9 (13.3) |
46.3 (7.9) |
33.4 (0.8) |
22.6 (−5.2) |
17.2 (−8.2) |
5.3 (−14.8) |
| Record low °F (°C) | −19 (−28) |
−6 (−21) |
1 (−17) |
17 (−8) |
30 (−1) |
38 (3) |
44 (7) |
45 (7) |
28 (−2) |
23 (−5) |
−1 (−18) |
−5 (−21) |
−19 (−28) |
| Average precipitation inches (mm) | 6.02 (153) |
4.82 (122) |
5.17 (131) |
5.93 (151) |
6.11 (155) |
6.93 (176) |
7.02 (178) |
6.97 (177) |
6.62 (168) |
5.60 (142) |
5.93 (151) |
7.08 (180) |
74.2 (1,884) |
| Average snowfall inches (cm) | 2.7 (6.9) |
1.6 (4.1) |
0.3 (0.76) |
0.0 (0.0) |
0.1 (0.25) |
0.0 (0.0) |
0.0 (0.0) |
0.0 (0.0) |
0.0 (0.0) |
0.0 (0.0) |
0.0 (0.0) |
2.6 (6.6) |
7.3 (18.61) |
| Average precipitation days (≥ 0.01 in) | 9.4 | 9.8 | 11.0 | 10.5 | 11.2 | 14.1 | 16.9 | 15.3 | 9.7 | 8.2 | 9.6 | 10.0 | 135.7 |
| Average snowy days (≥ 0.1 in) | 0.7 | 0.9 | 0.4 | 0.0 | 0.0 | 0.0 | 0.0 | 0.0 | 0.0 | 0.0 | 0.0 | 0.6 | 2.6 |
| Source: NOAA[9][7][10] | |||||||||||||
References
- ^ "ArcGIS REST Services Directory". United States Census Bureau. Retrieved October 15, 2022.
- ^ a b U.S. Geological Survey Geographic Names Information System: Caesars Head, South Carolina
- ^ a b "Census Population API". United States Census Bureau. Retrieved October 15, 2022.
- ^ "Caesars Head CDP, South Carolinaa". United States Census Bureau. Retrieved April 7, 2022.
- ^ "Decennial Census of Population and Housing by Decades". US Census Bureau.
- ^ a b "P2 HISPANIC OR LATINO, AND NOT HISPANIC OR LATINO BY RACE – 2020: DEC Redistricting Data (PL 94-171) – Caesars Head CDP, South Carolina". United States Census Bureau.
- ^ a b "NOAA Online Weather Data – NWS Greenville/Spartanburg". National Weather Service. Retrieved November 30, 2023.
- ^ https://www.ncei.noaa.gov/access/monitoring/scec/records/all/tmin
- ^ "U.S. Climate Normals Quick Access – Station: Caesars Head, SC". National Oceanic and Atmospheric Administration. Retrieved November 30, 2023.
- ^ "xmACIS2". National Oceanic and Atmospheric Administration. Retrieved November 30, 2023.
Municipalities and communities of Greenville County, South Carolina, United States | ||
|---|---|---|
| Cities | 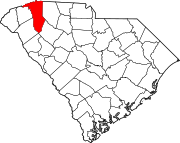 | |
| CDPs | ||
| Other communities | ||
| Footnotes | ‡This populated place also has portions in an adjacent county or counties | |

Recent Comments