How Can We Help?
The Football Conference season of 1997–98 was the nineteenth season of the Football Conference, also known as the Vauxhall Conference for sponsorship reasons.
Changes since the previous season
- Hereford United (relegated from the Football League 1996–97)
- Cheltenham Town (promoted 1996–97)
- Leek Town (promoted 1996–97)
- Yeovil Town (promoted 1996–97)
Final league table
| Pos | Team | Pld | HW | HD | HL | HGF | HGA | AW | AD | AL | AGF | AGA | GD | Pts | Promotion or relegation |
|---|---|---|---|---|---|---|---|---|---|---|---|---|---|---|---|
| 1 | Halifax Town | 42 | 17 | 4 | 0 | 51 | 15 | 8 | 8 | 5 | 23 | 28 | +31 | 87 | Football Conference Champions, promoted to Football League Division Three |
| 2 | Cheltenham Town[a] | 42 | 15 | 4 | 2 | 39 | 15 | 8 | 5 | 8 | 24 | 28 | +20 | 78 | FA Trophy winners |
| 3 | Woking | 42 | 14 | 3 | 4 | 47 | 22 | 8 | 5 | 8 | 25 | 24 | +26 | 74 | |
| 4 | Rushden & Diamonds | 42 | 12 | 4 | 5 | 44 | 26 | 11 | 1 | 9 | 35 | 31 | +22 | 74 | |
| 5 | Morecambe | 42 | 11 | 4 | 6 | 35 | 30 | 10 | 6 | 5 | 42 | 34 | +13 | 73 | Conference League Cup winners |
| 6 | Hereford United | 42 | 11 | 7 | 3 | 30 | 19 | 7 | 6 | 8 | 26 | 30 | +7 | 67 | Relegated from The Football League |
| 7 | Hednesford Town | 42 | 14 | 4 | 3 | 28 | 12 | 4 | 8 | 9 | 31 | 38 | +9 | 66 | |
| 8 | Slough Town | 42 | 10 | 6 | 5 | 34 | 21 | 8 | 4 | 9 | 24 | 28 | +9 | 64 | Demoted to Isthmian League.[b] |
| 9 | Northwich Victoria | 42 | 8 | 9 | 4 | 34 | 24 | 7 | 6 | 8 | 29 | 35 | +4 | 60 | |
| 10 | Welling United | 42 | 11 | 5 | 5 | 39 | 27 | 6 | 4 | 11 | 25 | 35 | +2 | 60 | |
| 11 | Yeovil Town[a] | 42 | 14 | 3 | 4 | 45 | 24 | 3 | 5 | 13 | 28 | 39 | +10 | 59 | |
| 12 | Hayes | 42 | 10 | 4 | 7 | 36 | 25 | 6 | 6 | 9 | 26 | 27 | +10 | 58 | |
| 13 | Dover Athletic | 42 | 10 | 4 | 7 | 34 | 29 | 5 | 6 | 10 | 26 | 41 | −10 | 55 | |
| 14 | Kettering Town | 42 | 8 | 6 | 7 | 29 | 29 | 5 | 7 | 9 | 24 | 31 | −7 | 52 | |
| 15 | Stevenage Borough | 42 | 8 | 8 | 5 | 35 | 27 | 5 | 4 | 12 | 24 | 36 | −4 | 51 | |
| 16 | Southport | 42 | 9 | 5 | 7 | 32 | 26 | 4 | 6 | 11 | 24 | 32 | −2 | 50 | |
| 17 | Kidderminster Harriers | 42 | 6 | 8 | 7 | 32 | 31 | 5 | 6 | 10 | 24 | 32 | −7 | 47 | |
| 18 | Farnborough Town | 42 | 10 | 3 | 8 | 37 | 27 | 2 | 5 | 14 | 19 | 43 | −14 | 44 | |
| 19 | Leek Town[a] | 42 | 8 | 8 | 5 | 34 | 26 | 2 | 6 | 13 | 18 | 41 | −15 | 44 | |
| 20 | Telford United | 42 | 6 | 7 | 8 | 25 | 31 | 4 | 5 | 12 | 28 | 45 | −23 | 42 | |
| 21 | Gateshead | 42 | 7 | 6 | 8 | 32 | 35 | 1 | 5 | 15 | 19 | 52 | −36 | 35 | Relegated to the Northern Premier League |
| 22 | Stalybridge Celtic | 42 | 6 | 5 | 10 | 33 | 38 | 1 | 3 | 17 | 15 | 55 | −45 | 29 |
Source: [1]
Notes:
Notes:
- ^ a b c New club in the Conference
- ^ Slough Town were demoted because their ground did not meet Conference National requirements. They were demoted to the Isthmian League Premier Division.
Results
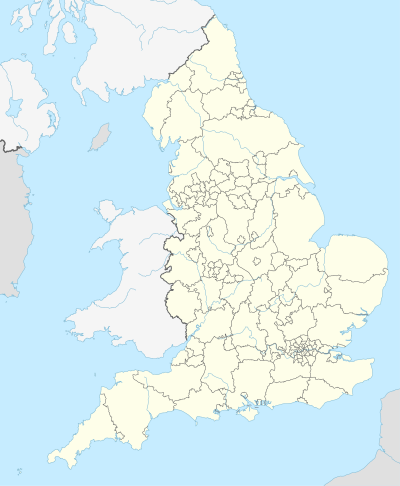
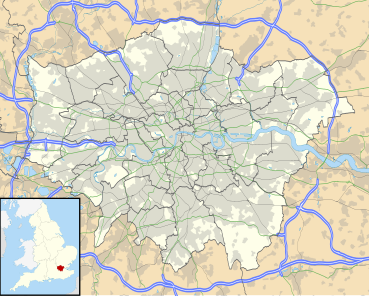
Locations of the Football Conference London teams 1997–1998
Top scorers in order of league goals
| Rank | Player | Club | League | FA Cup | FA Trophy | League Cup | Total[1] |
|---|---|---|---|---|---|---|---|
| 1 | Geoff Horsfield | Halifax Town | 30 | 4 | 0 | 0 | 34 |
| 2 | Darren Collins | Rushden & Diamonds | 29 | 0 | 3 | 0 | 32 |
| 3 | Darran Hay | Woking | 20 | 0 | 0 | 1 | 21 |
| 4 | Mark Cooper | Welling United | 18 | 1 | 0 | 0 | 19 |
| = | John Norman | Morecambe | 18 | 0 | 0 | 3 | 21 |
| 6 | Neil Grayson | Hereford United & Cheltenham Town | 17 | 4 | 0 | 1 | 22 |
| 7 | Owen Pickard | Yeovil Town | 17 | 6 | 0 | 1 | 24 |
| = | Dale Watkins | Cheltenham Town | 17 | 4 | 7 | 1 | 29 |
| = | Mike Bignall | Kidderminster Harriers | 16 | 1 | 0 | 0 | 17 |
| = | Brendan Burke | Stalybridge Celtic | 16 | 2 | 1 | 1 | 20 |
| = | Jason Eaton | Cheltenham Town | 16 | 2 | 4 | 0 | 22 |
| = | David Mehew | Rushden & Diamonds | 16 | 1 | 0 | 0 | 17 |
| = | Warren Patmore | Yeovil Town | 16 | 0 | 0 | 1 | 17 |
| 14 | Ritchie Hanlon | Welling United | 15 | 0 | 0 | 0 | 15 |
| = | Martin Randall | Hayes | 15 | 0 | 2 | 2 | 19 |
| 16 | Jamie Paterson | Halifax Town | 14 | 3 | 1 | 0 | 18 |
| = | Grant Payne | Woking | 14 | 0 | 0 | 1 | 15 |
| = | Chris Pearson | Kettering Town | 14 | 0 | 0 | 0 | 14 |
| 19 | Andy Milner | Morecambe | 13 | 0 | 0 | 2 | 15 |
| 20 | Steve Bowey | Gateshead | 12 | 1 | 1 | 0 | 14 |
| = | Jimmy Strouts | Dover Athletic | 12 | 0 | 0 | 1 | 13 |
- Footballtransfers.co.uk contains information on many players on whom there is not yet an article in Wikipedia.


Recent Comments