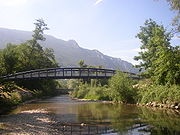
Le Bourget-du-Lac (French pronunciation: [lə buʁʒɛ dy lak], literally Le Bourget of the Lake or Arpitan: Le Borgèt-du-Lèc[1]) is a commune in the Savoie department in the Auvergne-Rhône-Alpes region in eastern/south-eastern France.
It lies near the Lac du Bourget and 12 km (7.5 mi) from Chambéry.
Climate
Le Bourget-du-Lac is right on the boundary between a mid-latitude, four seasons humid subtropical climate (Cfa) and an oceanic climate (Cfb) under the Köppen system. In spite of this, it is highly influenced by its interior position within France, near several mountain ranges, resulting in quite hot summers and winters with frequent temperatures below freezing, especially at night. Convective rainfall is frequent for much of the year, rendering high precipitation/day quotas. The nearest weather station is located at Chambéry Airport, 3 km east of the town.
| Climate data for Le Bourget-du-Lac (Chambéry Airport, altitude 235m,[3] 1991–2020 normals, extremes 1973–present) | |||||||||||||
|---|---|---|---|---|---|---|---|---|---|---|---|---|---|
| Month | Jan | Feb | Mar | Apr | May | Jun | Jul | Aug | Sep | Oct | Nov | Dec | Year |
| Record high °C (°F) | 17.9 (64.2) |
20.5 (68.9) |
25.1 (77.2) |
29.5 (85.1) |
32.7 (90.9) |
36.7 (98.1) |
38.8 (101.8) |
38.8 (101.8) |
32.0 (89.6) |
29.0 (84.2) |
23.3 (73.9) |
22.7 (72.9) |
38.8 (101.8) |
| Mean daily maximum °C (°F) | 6.4 (43.5) |
8.5 (47.3) |
13.4 (56.1) |
17.3 (63.1) |
21.3 (70.3) |
25.3 (77.5) |
27.8 (82.0) |
27.1 (80.8) |
22.3 (72.1) |
17.0 (62.6) |
10.6 (51.1) |
6.9 (44.4) |
17.0 (62.6) |
| Daily mean °C (°F) | 2.9 (37.2) |
4.1 (39.4) |
8.0 (46.4) |
11.4 (52.5) |
15.6 (60.1) |
19.4 (66.9) |
21.4 (70.5) |
20.9 (69.6) |
16.8 (62.2) |
12.3 (54.1) |
6.9 (44.4) |
3.4 (38.1) |
11.9 (53.4) |
| Mean daily minimum °C (°F) | −0.7 (30.7) |
−0.4 (31.3) |
2.5 (36.5) |
5.6 (42.1) |
10.0 (50.0) |
13.5 (56.3) |
15.0 (59.0) |
14.6 (58.3) |
11.3 (52.3) |
7.7 (45.9) |
3.1 (37.6) |
0.0 (32.0) |
6.8 (44.2) |
| Record low °C (°F) | −19.0 (−2.2) |
−14.4 (6.1) |
−10.3 (13.5) |
−4.6 (23.7) |
−1.4 (29.5) |
2.8 (37.0) |
5.4 (41.7) |
5.0 (41.0) |
1.0 (33.8) |
−4.3 (24.3) |
−10.8 (12.6) |
−13.5 (7.7) |
−19.0 (−2.2) |
| Average precipitation mm (inches) | 102.6 (4.04) |
79.1 (3.11) |
93.1 (3.67) |
87.9 (3.46) |
101.0 (3.98) |
94.5 (3.72) |
91.7 (3.61) |
97.6 (3.84) |
104.3 (4.11) |
113.3 (4.46) |
114.6 (4.51) |
124.2 (4.89) |
1,203.9 (47.40) |
| Average precipitation days (≥ 1.0 mm) | 9.7 | 8.1 | 9.7 | 9.6 | 11.1 | 9.9 | 8.2 | 8.5 | 8.8 | 10.3 | 10.1 | 10.6 | 114.6 |
| Average snowy days | 5.4 | 4.6 | 2.2 | 1.2 | 0.0 | 0.0 | 0.0 | 0.0 | 0.0 | 0.0 | 1.7 | 3.2 | 18.3 |
| Mean monthly sunshine hours | 76.6 | 101.8 | 157.8 | 176.2 | 202.3 | 236.3 | 261.6 | 237.1 | 180.7 | 123.8 | 74.5 | 66.3 | 1,894.9 |
| Source 1: Météo-France[4] | |||||||||||||
| Source 2: Infoclimat.fr[5] | |||||||||||||
Population
| Year | Pop. | ±% p.a. |
|---|---|---|
| 1968 | 1,849 | — |
| 1975 | 1,863 | +0.11% |
| 1982 | 2,098 | +1.71% |
| 1990 | 2,886 | +4.07% |
| 1999 | 3,945 | +3.53% |
| 2007 | 4,155 | +0.65% |
| 2012 | 4,489 | +1.56% |
| 2017 | 4,866 | +1.63% |
| Source: INSEE[6] | ||
Gallery
See also
References
- ^ "Répertoire national des élus: les maires" (in French). data.gouv.fr, Plateforme ouverte des données publiques françaises. 13 September 2022.
- ^ "Populations légales 2021" (in French). The National Institute of Statistics and Economic Studies. 28 December 2023.
- ^ Meteo France Weather Station
- ^ "Fiche Climatologique Statistiques 1991-2020 et records" (PDF) (in French). Météo-France. Retrieved September 5, 2022.
- ^ "Normales et records pour la période 1981-2010 à Chambéry - Aix-Les-Bains" (in French). Infoclimat.fr. Retrieved September 5, 2022.
- ^ Population en historique depuis 1968, INSEE


Recent Comments