How Can We Help?
You are here:
< Back

Size of this PNG preview of this SVG file: 422 × 421 pixels. Other resolutions: 241 × 240 pixels | 481 × 480 pixels | 770 × 768 pixels | 1,026 × 1,024 pixels | 2,053 × 2,048 pixels.
Original file (SVG file, nominally 422 × 421 pixels, file size: 26 KB)
Summary
| DescriptionCollatz Cobweb.svg |
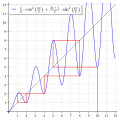
English: Cobweb plot of  , an extension of the Collatz map to the real line, studied by Marc Chamberland. The orbit of the starting point , an extension of the Collatz map to the real line, studied by Marc Chamberland. The orbit of the starting point  is shown in red, with values is shown in red, with values  . . |
||
| Date | |||
| Source | Own work | ||
| Author | Hugo Spinelli | ||
| SVG development InfoField | This vector image was created with Inkscape. | ||
| Source code InfoField | Try it here (permalink). Cleaned up with Inkscape afterwards.
|
Licensing
I, the copyright holder of this work, hereby publish it under the following license:
| This file is made available under the Creative Commons CC0 1.0 Universal Public Domain Dedication. | |
| The person who associated a work with this deed has dedicated the work to the public domain by waiving all of their rights to the work worldwide under copyright law, including all related and neighboring rights, to the extent allowed by law. You can copy, modify, distribute and perform the work, even for commercial purposes, all without asking permission.
http://creativecommons.org/publicdomain/zero/1.0/deed.enCC0Creative Commons Zero, Public Domain Dedicationfalsefalse |
Captions
Cobweb plot of Chamberland's extension of the Collatz map, with the orbit of the starting point x = 10.
Items portrayed in this file
depicts
Collatz Conjecture
cobweb plot
creator
some value
author name string: Hugo Spinelli
Wikimedia username: Hugo Spinelli
copyright status
copyrighted, dedicated to the public domain by copyright holder
copyright license
Creative Commons CC0 License
source of file
original creation by uploader
inception
5 October 2023
media type
image/svg+xml
checksum
851e6b2d103653e07f4c8714fcb238e86bbb5b19
determination method: SHA-1
data size
26,657 byte
height
421 pixel
width
422 pixel
File history
Click on a date/time to view the file as it appeared at that time.
| Date/Time | Thumbnail | Dimensions | User | Comment | |
|---|---|---|---|---|---|
| current | 21:39, 5 October 2023 |  | 422 × 421 (26 KB) | Hugo Spinelli | Uploaded own work with UploadWizard |
File usage
The following pages on the English Wikipedia use this file (pages on other projects are not listed):
Global file usage
The following other wikis use this file:
- Usage on zh.wikipedia.org
Metadata
This file contains additional information, probably added from the digital camera or scanner used to create or digitize it.
If the file has been modified from its original state, some details may not fully reflect the modified file.
| Width | 337.44pt |
|---|---|
| Height | 337.11pt |
Categories
-
Annuals36
-
Bulbs, Corms & Tubers41
-
Ferns27
-
Fruits3
-
Garden Plants23
-
Grasses26
-
Herb17
-
Insects1
-
Mammals1
-
Midwest Native Plants0
-
Northeast Native Plants112
-
Perennials123
-
Rose1
-
Shrubs47
-
Trees112
-
Tropical Plants53
-
Upland Birds5
-
Vines18
-
Viola Tricolor1
-
Water Gardening & Plants9
-
Waterfowl0
-
Wetland Birds0
-
Wetland Plants4
-
Wildbirds172
-
Wildflowers1
-
Woodland Plants29
Table of Contents


Recent Comments