
Les Arcs (French pronunciation: [le.z‿aʁk], also known as Les Arcs-sur-Argens, literally Les Arcs on Argens; Occitan: Los Arcs) is a commune in the Var department in the Provence-Alpes-Côte d'Azur region in Southeastern France.
Geography
Les Arcs is served by Les Arcs–Draguignan station (Gare des Arcs–Draguignan) on the Marseille–Ventimiglia railway. The station, located within the commune of Les Arcs, also serves the greater neighbouring city of Draguignan, as the name suggests.
-
 Les Arcs Town Hall
 -
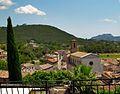 A view of Les Arcs


Climate
Les Arcs has a hot-summer Mediterranean climate (Köppen climate classification Csa). The average annual temperature in Les Arcs is 15.5 °C (59.9 °F). The average annual rainfall is 803.1 mm (31.62 in) with November as the wettest month. The temperatures are highest on average in July, at around 24.8 °C (76.6 °F), and lowest in January, at around 7.3 °C (45.1 °F). The highest temperature ever recorded in Les Arcs was 41.3 °C (106.3 °F) on 27 June 2019; the coldest temperature ever recorded was −8.7 °C (16.3 °F) on 13 February 1999.
| Climate data for Les Arcs (1991−2020 normals, extremes 1997−present) | |||||||||||||
|---|---|---|---|---|---|---|---|---|---|---|---|---|---|
| Month | Jan | Feb | Mar | Apr | May | Jun | Jul | Aug | Sep | Oct | Nov | Dec | Year |
| Record high °C (°F) | 23.1 (73.6) |
26.3 (79.3) |
28.2 (82.8) |
30.8 (87.4) |
35.5 (95.9) |
41.3 (106.3) |
39.7 (103.5) |
40.7 (105.3) |
37.5 (99.5) |
33.5 (92.3) |
26.3 (79.3) |
22.5 (72.5) |
41.3 (106.3) |
| Mean daily maximum °C (°F) | 13.1 (55.6) |
14.5 (58.1) |
17.8 (64.0) |
20.9 (69.6) |
25.1 (77.2) |
30.0 (86.0) |
33.0 (91.4) |
33.0 (91.4) |
28.2 (82.8) |
22.8 (73.0) |
16.8 (62.2) |
13.3 (55.9) |
22.4 (72.3) |
| Daily mean °C (°F) | 7.3 (45.1) |
8.1 (46.6) |
11.0 (51.8) |
14.1 (57.4) |
18.0 (64.4) |
22.3 (72.1) |
24.8 (76.6) |
24.7 (76.5) |
20.6 (69.1) |
16.5 (61.7) |
11.2 (52.2) |
7.9 (46.2) |
15.5 (59.9) |
| Mean daily minimum °C (°F) | 1.6 (34.9) |
1.7 (35.1) |
4.1 (39.4) |
7.2 (45.0) |
11.0 (51.8) |
14.5 (58.1) |
16.7 (62.1) |
16.4 (61.5) |
13.1 (55.6) |
10.1 (50.2) |
5.7 (42.3) |
2.5 (36.5) |
8.7 (47.7) |
| Record low °C (°F) | −8.2 (17.2) |
−8.7 (16.3) |
−8.2 (17.2) |
−2.8 (27.0) |
3.1 (37.6) |
4.1 (39.4) |
8.7 (47.7) |
8.9 (48.0) |
4.2 (39.6) |
−2.2 (28.0) |
−8.1 (17.4) |
−8.6 (16.5) |
−8.7 (16.3) |
| Average precipitation mm (inches) | 61.9 (2.44) |
52.8 (2.08) |
52.5 (2.07) |
66.4 (2.61) |
56.8 (2.24) |
57.7 (2.27) |
16.4 (0.65) |
32.7 (1.29) |
62.9 (2.48) |
117.0 (4.61) |
146.6 (5.77) |
79.4 (3.13) |
803.1 (31.62) |
| Average precipitation days (≥ 1.0 mm) | 5.6 | 5.4 | 5.8 | 6.7 | 5.6 | 3.5 | 1.9 | 2.9 | 4.6 | 6.6 | 8.3 | 6.1 | 63.0 |
| Source: Météo-France[3] | |||||||||||||
Population
| Year | Pop. | ±% p.a. |
|---|---|---|
| 1968 | 3,324 | — |
| 1975 | 3,324 | +0.00% |
| 1982 | 3,786 | +1.88% |
| 1990 | 4,744 | +2.86% |
| 1999 | 5,334 | +1.31% |
| 2009 | 6,305 | +1.69% |
| 2014 | 7,171 | +2.61% |
| 2020 | 7,292 | +0.28% |
| Source: INSEE[4] | ||
See also
References
- ^ "Répertoire national des élus: les maires" (in French). data.gouv.fr, Plateforme ouverte des données publiques françaises. 13 September 2022.
- ^ "Populations légales 2021" (in French). The National Institute of Statistics and Economic Studies. 28 December 2023.
- ^ "Fiche Climatologique Statistiques 1991-2020 et records" (PDF) (in French). Météo-France. Retrieved September 13, 2022.
- ^ Population en historique depuis 1968, INSEE
External links
- Official website (in French)
| International | |
|---|---|
| National | |
| Geographic | |

Recent Comments