How Can We Help?
This is the results breakdown of the local elections held in Cantabria on 13 June 1999. The following tables show detailed results in the autonomous community's most populous municipalities, sorted alphabetically.[1][2][3]
City control
The following table lists party control in the most populous municipalities, including provincial capitals (shown in bold).[1] Gains for a party are displayed with the cell's background shaded in that party's colour.
| Municipality | Population | Previous control | New control | ||
|---|---|---|---|---|---|
| Santander | 184,165 | People's Party (PP) | People's Party (PP) | ||
| Torrelavega | 57,493 | Spanish Socialist Workers' Party (PSOE) | Regionalist Party of Cantabria (PRC) | ||
Municipalities
Santander
- Population: 184,165
 | ||||||
| Parties and alliances | Popular vote | Seats | ||||
|---|---|---|---|---|---|---|
| Votes | % | ±pp | Total | +/− | ||
| People's Party (PP) | 42,659 | 46.32 | +9.25 | 15 | +4 | |
| Spanish Socialist Workers' Party (PSOE) | 29,344 | 31.86 | +8.29 | 10 | +3 | |
| Regionalist Party of Cantabria (PRC) | 6,914 | 7.51 | –5.29 | 2 | –1 | |
| United Left of Cantabria (IUC) | 4,350 | 4.72 | –5.09 | 0 | –3 | |
| Union for the Progress of Cantabria (UPCA) | 2,588 | 2.81 | –9.42 | 0 | –3 | |
| Cantabrian Nationalist Council (CNC) | 504 | 0.55 | New | 0 | ±0 | |
| Centrist Union–Democratic and Social Centre (UC–CDS) | 430 | 0.47 | +0.04 | 0 | ±0 | |
| Unemployed Collective of Cantabria (COPARCA) | 402 | 0.44 | New | 0 | ±0 | |
| Spanish Democratic Party (PADE) | 271 | 0.29 | New | 0 | ±0 | |
| The Phalanx (FE) | 164 | 0.18 | New | 0 | ±0 | |
| Humanist Party (PH) | 125 | 0.14 | New | 0 | ±0 | |
| Blank ballots | 4,350 | 4.72 | +2.29 | |||
| Total | 92,101 | 27 | ±0 | |||
| Valid votes | 92,101 | 99.19 | +0.05 | |||
| Invalid votes | 751 | 0.81 | –0.05 | |||
| Votes cast / turnout | 92,852 | 58.92 | –5.79 | |||
| Abstentions | 64,727 | 41.08 | +5.79 | |||
| Registered voters | 157,579 | |||||
| Sources[1][4][5] | ||||||
Torrelavega
- Population: 57,493
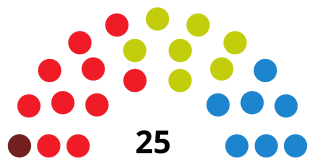
 | ||||||
| Parties and alliances | Popular vote | Seats | ||||
|---|---|---|---|---|---|---|
| Votes | % | ±pp | Total | +/− | ||
| Spanish Socialist Workers' Party (PSOE) | 12,868 | 37.31 | +2.85 | 10 | ±0 | |
| People's Party (PP) | 8,775 | 25.44 | –4.96 | 7 | –1 | |
| Regionalist Party of Cantabria (PRC) | 8,338 | 24.17 | +10.27 | 7 | +3 | |
| United Left of Cantabria (IUC) | 1,743 | 5.05 | –5.19 | 1 | –1 | |
| Independent Citizens (CCII) | 898 | 2.60 | +0.82 | 0 | ±0 | |
| Centrist Union–Democratic and Social Centre (UC–CDS) | 565 | 1.64 | –0.27 | 0 | ±0 | |
| Union for the Progress of Cantabria (UPCA) | 403 | 1.17 | –3.92 | 0 | –1 | |
| Humanist Party (PH) | 60 | 0.17 | New | 0 | ±0 | |
| Blank ballots | 844 | 2.45 | +0.52 | |||
| Total | 34,494 | 25 | ±0 | |||
| Valid votes | 34,494 | 99.00 | –0.37 | |||
| Invalid votes | 347 | 1.00 | +0.37 | |||
| Votes cast / turnout | 34,841 | 72.28 | –7.08 | |||
| Abstentions | 13,362 | 27.72 | +7.08 | |||
| Registered voters | 48,203 | |||||
| Sources[1][4][6] | ||||||
See also
References
- ^ a b c d "Elecciones Municipales en Asturias y Cantabria (1979-2019)". Historia Electoral.com (in Spanish). Retrieved 21 October 2021.
- ^ "Elecciones Municipales. 13 de junio de 1999. Cantabria". eldiario.es (in Spanish). Retrieved 3 July 2020.
- ^ "13J/Elecciones Municipales 1999. Cantabria". Público (in Spanish). Retrieved 3 July 2020.
- ^ a b "Acuerdo de 15 de julio de 1999, de la Junta Electoral Central, por el que se procede a la publicación del resumen de los resultados de las elecciones locales convocadas por Real Decreto 606/1999, de 19 de abril, y celebradas el 13 de junio, según los datos que figuran en las actas de proclamación remitidas por cada una de las Juntas Electorales de Zona" (PDF) (in Spanish). Boletín Oficial del Estado. Retrieved 22 October 2021.
- ^ "Electoral Results Consultation. Municipal. June 1999. Santander Municipality". Ministry of the Interior (in Spanish). Retrieved 3 July 2020.
- ^ "Electoral Results Consultation. Municipal. June 1999. Torrelavega Municipality". Ministry of the Interior (in Spanish). Retrieved 3 July 2020.


Recent Comments